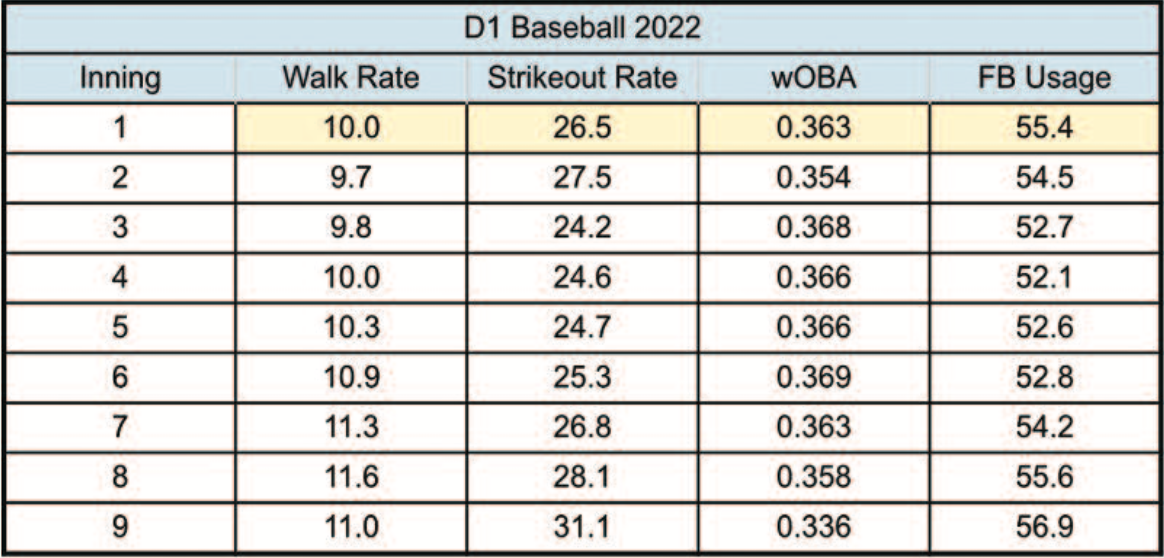
 Our friends at 643 Charts assembled this graph that details walk rate, strikeout rate, wOBA and fastball usage as it pertains to each inning, one through nine, of Division I baseball games from 2022. Here are the takeaways:
Walks in the park
The lowest walk rates can be found in the second (9.7) and third (9.8) innings, typically after a starter has settled into the game and is most likely facing the bottom of the batting order. This rate continues to steadily climb all the way through the 8th (11.6) inning as lineups turn over and middle relievers are used. The biggest jump in walk rate is from the 5th to the 6th, which is the most common time that teams will pull their starter and go to the pen.
Closing the Door
After starting at 26.5 in the first inning and increasing to 27.5 in the second, K rate bottoms out in the third (24.2) as the lineup turns over. This number climbs for the rest of the game. As most would expect, strikeout rate in DI baseball peaks in the ninth inning, and it’s not particularly close. The back end of the bullpen is where the most swing-and-miss on a pitching staff is often found. Interestingly enough, this is the inning where fastball usage is also at its highest and wOBA is at its lowest. Walk rate also settles back down to 11, just a percentage point higher than the first inning.
Third Time’s a Charm
In terms of wOBA, the most damage that is done across DI baseball is in the third inning, again, when the top of the lineup is likely rolling over as a team’s best hitters get to see the starter for a second time. Some teams are combatting this reality by using “openers” who face a batting order one time through, in hopes that their “piggyback” starter can get them deep into the game or even finish it. wOBA stays steady (.363-.368) through the middle innings and into the seventh before falling off in the 8th and 9th as the back end of the bullpen gets its cracks.
Give ’em the Heater
The most fastballs in a DI ballgame can be found in the eighth (55.6 percent) and ninth (56.9) innings, again where the setup men and closers are typically in the game. These figures are followed closely by the first inning, where starting pitchers are establishing their heaters. FB usage is at its lowest in the fourth through the sixth innings, where starters are pitching backwards more often and relievers are coming in from the pen to feature their best offspeed offerings. One takeaway? Be aggressive and ready to hit the heater early and late, and have the ability to adjust your approach to a more offspeed-heavy arsenal in between!
Special thanks to Derek Weldon and Natalie Hansen of 643 Charts for the data. 643’s new PLUS package boasts enhanced spray charts, scouting tools and Web Application features. Other tools programs can utilize include TrackMan SYNC, which makes Trackman data more accessible than ever with 643’s new FTP registration process. 643 has also partnered with Synergy, which allows the mapping of TrackMan events to their video counterpart to “bring data to life.” For more information, visit www.643charts.com.